Summary
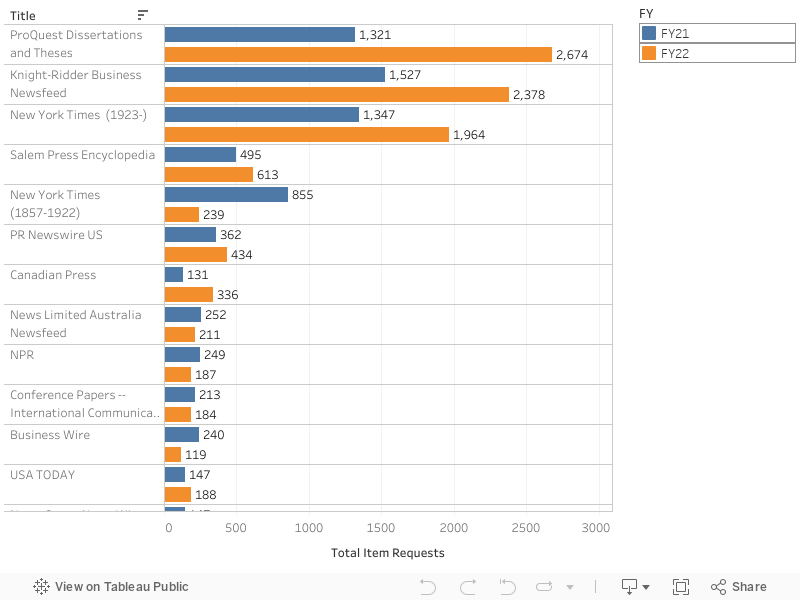
All of the data visualized below is COUNTER 5. The list below displays the most highly used news sources, magazines, and thesis/dissertation providers in FY21 and FY22. The number of "total item requests" is listed for each title. A separate metric of "unique item requests" is also listed under the details for each bar, which can be viewed by hovering over the bar. Please see the glossary section for an explanation of the difference between these two metrics.
Top News, Dissertations & Theses Sources
Top 10 with New York Times & the Chronicle of Higher Ed. Included
| Title | Article Downloads |
|
New York Times
|
155,108 |
|
Chronicle of Higher Education
|
19,662 |
|
ProQuest Dissertations and Theses
|
2,674 |
|
Knight-Ridder Business Newsfeed
|
2,378 |
|
New York Times (1923-)
|
1,964 |
|
Salem Press Encyclopedia
|
613 |
|
PR Newswire US
|
434 |
|
Canadian Press
|
336 |
|
The Chicago Defender (National edition) (1921-1967)
|
298 |
|
New York Times (1857-1922)
|
239 |
Notes
The first visual displays the top 100 titles for FY21 and FY22. The "new york times (1857-1922)" and "new york times (1923-)" usage is from EBSCO and ProQuest; it does not represent usage through the university's separate subscription to NYTimes.com. The NYTimes.com access was excluded in the first visual because it is not COUNTER, and the usage is so high that it would render the other statistics hard to decipher. The Chronicle of Higher Education usage was also excluded for this reason. Please see the second visual (table above) for the numbers for these two titles. Also note, only the NYTimes.com and Chronicle usage is included on the download sub-page for "News & Magazines" (https://libguides.udayton.edu/e-resources-usage-dashboard/news-and-magazines-downloads). This occurred as a result of how we configured the LibInsight report we ran to harvest the data. Rather than creating a separate dataset for news/magazines/theses/dissertations (in addition to the two reports we created, one for e-books and one for e-journals), we instead pulled this data within the same LibInsight dataset for e-journals. This still allowed us to see the most popular news/magazines/theses/dissertations at the title level (defined by LibInsight as the most popular titles in the format of "other"), but it did not allow us to see differentiate how many articles were retrieved by different format (i.e. for EBSCO we couldn't see how many e-journal articles were retrieved vs. how many news articles were retrieved vs. how many theses, etc). Instead, the total number of item requests/retrievals was listed for each platform, and in the case of the LibInsight report for e-journals, this included everything except for multimedia and ebooks. As a result, the data visualized in the first visual on this page is included in the "Scholarly Articles" downloads subpage (https://libguides.udayton.edu/e-resources-usage-dashboard/scholarly-article-downloads) instead of in the sub-page for "News & Magazines" downloads (https://libguides.udayton.edu/e-resources-usage-dashboard/news-and-magazines-downloads). Going forward we might create a third report for popular news/magazines/theses/dissertations so that there are three LibInsight reports: E-Books, E-Journals, and News, Magazines, Theses, & Dissertations.

